

By Soham Gupta, Tobias Elbs, Adithya Madduri, Benjamin Megan, and Onyinyechukwu Okonkwo
A typical 82-game NBA regular season is replete with injuries, winning and losing streaks, blowouts, game-winners, and god-like performances. Adding in the modern-day strategies of resting star players andtrading players mid-season (or even sometimes mid-game) on top of basketball drama and the newly introduced in-season tournament makes the NBA season quite a crazy ride. In short, there is nothing regular about the regular season.
Compare that to the playoffs, and the sport becomes almost unrecognizable. In the postseason, every team is 100% “locked in.” Offenses transition away from flashy isolation plays in favor of boring and effective pick-and-rolls. Defenses run back on transition and solidify their help side. Star players getting themselves ejected becomes incredibly rare (if we ignore Draymond Green of course). Every year in May, the stakes are higher and basketball is once again pure.
This huge disparity in the game makes it almost obvious that trying to predict the NBA champion purely based on regular season performance would likely be a hopeless endeavor (look no further than your favorite 73-win team). But this now begs the question: what is the best way to predict playoff success before the playoffs even start?
This is the question we will try to answer in this article. Our goal is to find the best regular season metric for predicting an NBA team’s playoff performance. We specifically choose to compare six regular season metrics: win-loss record, age, wins against playoff teams, margin of victory, fan attendance, and effective field goal percentage.
Method
To measure which regular season metrics are most highly correlated with playoff performance, we performed a series of linear regressions using aggregated data from 2003 to 2023, sourced from Basketball Reference. For each metric, we ranked the teams in order to create seeds. Then, for each seed and the aggregated data, we calculated the average seed of that team in the playoffs. This gives us a direct relationship between a given metric for a team and playoff performance.
We then saw how closely the line of best fit modeling this relationship matches the actual plotted points on the graph. Numerically, we use correlation coefficients to measure the strength of our linear relationship. A correlation coefficient with an absolute value close to 1 indicates a strong linear relationship and hence suggests that our metric is a powerful predictor of postseason prowess.
Win-Loss Records
A natural first step for our analysis is to turn to the records of NBA teams throughout the regular season. If we purely analyze regular season seed in comparison to expected playoff performance, our linear regression exhibits a strong, positive linear relationship with a correlation coefficient of 0.937, as shown below in Figure 1.
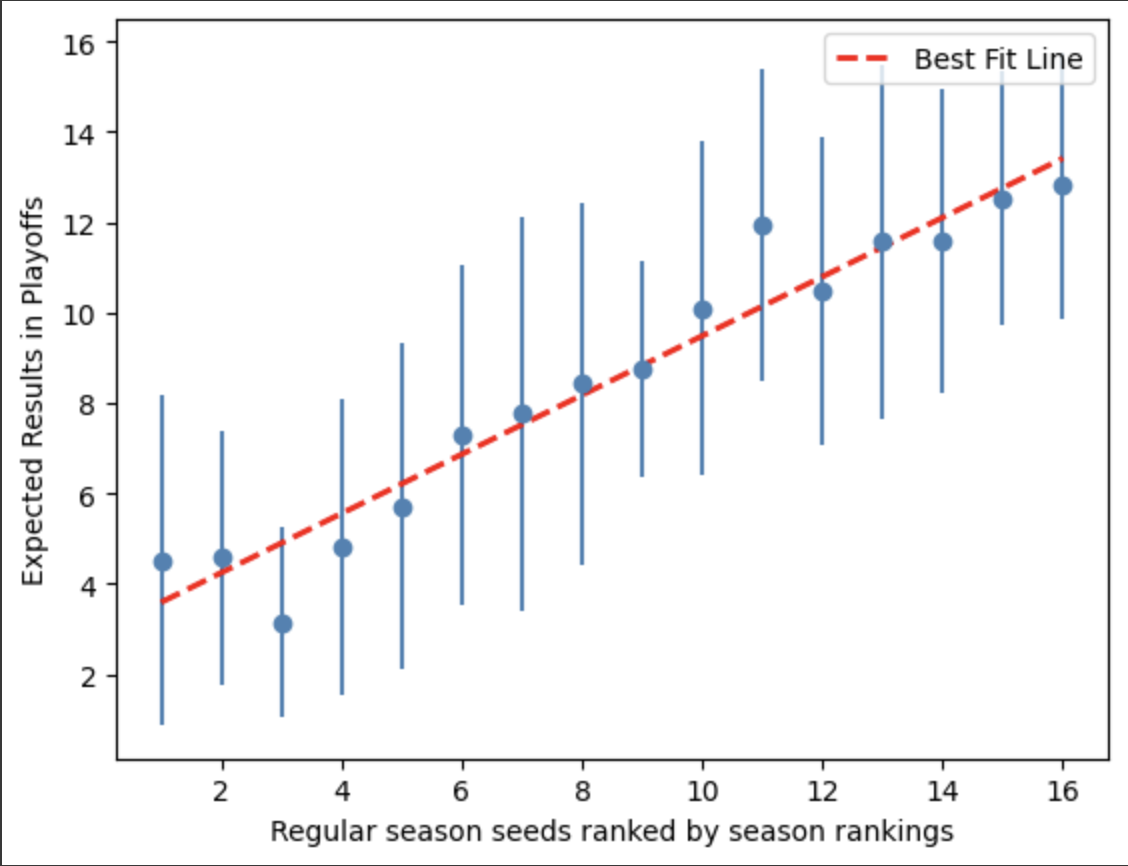
Figure 1: Expected Playoff Results vs. Regular Season Seeds Ranked by In-Season Rankings
However, our correlation coefficient doesn’t tell the whole story. For lower ranked teams (teams with higher seeds), our model is fairly accurate, and for the most part, the actual value is not far from the prediction given by our line of best fit. Predicting the highest seeds in the playoffs, though, is much less reliable. The expected playoff results for the top regular season seeds vary greatly and regular season ranking turns out to be a pretty poor metric.
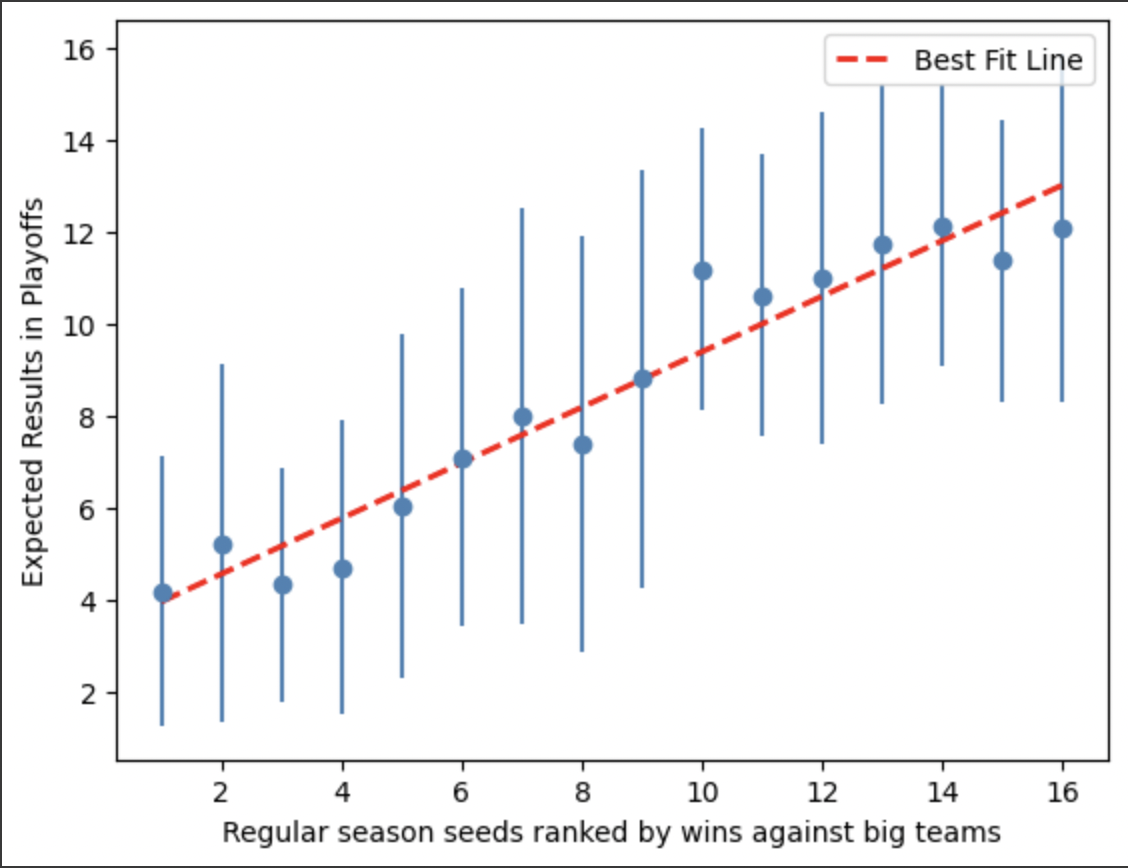
Figure 2: Expected Playoff Results vs. Regular Season Seeds Ranked by Wins Against Playoff Teams
Our next thought was to restrict regular season results to only look at games against playoff teams. Although our correlation coefficient is slightly lower at 0.929, the actual variation against playoff performance is much more consistent throughout the season. Especially for the best teams (with the lowest numbered seeds), we can more accurately predict the end result of their playoff run. By looking at how playoff teams compete against high quality competition, we get a clearer picture of their playoff success. Still, we look to improve.
Basketball Stats
For our next attempt, we zoomed past the win-loss column and decided to analyze performance statistics. Since games can often be defined by overly impressive (or unimpressive) performances or chance events (like referee calls or game-winning shots), a team’s record is far from an objective reality of “how good they are.” Instead, we can analyze a team’s performance by analyzing how well they “put points on the board.”
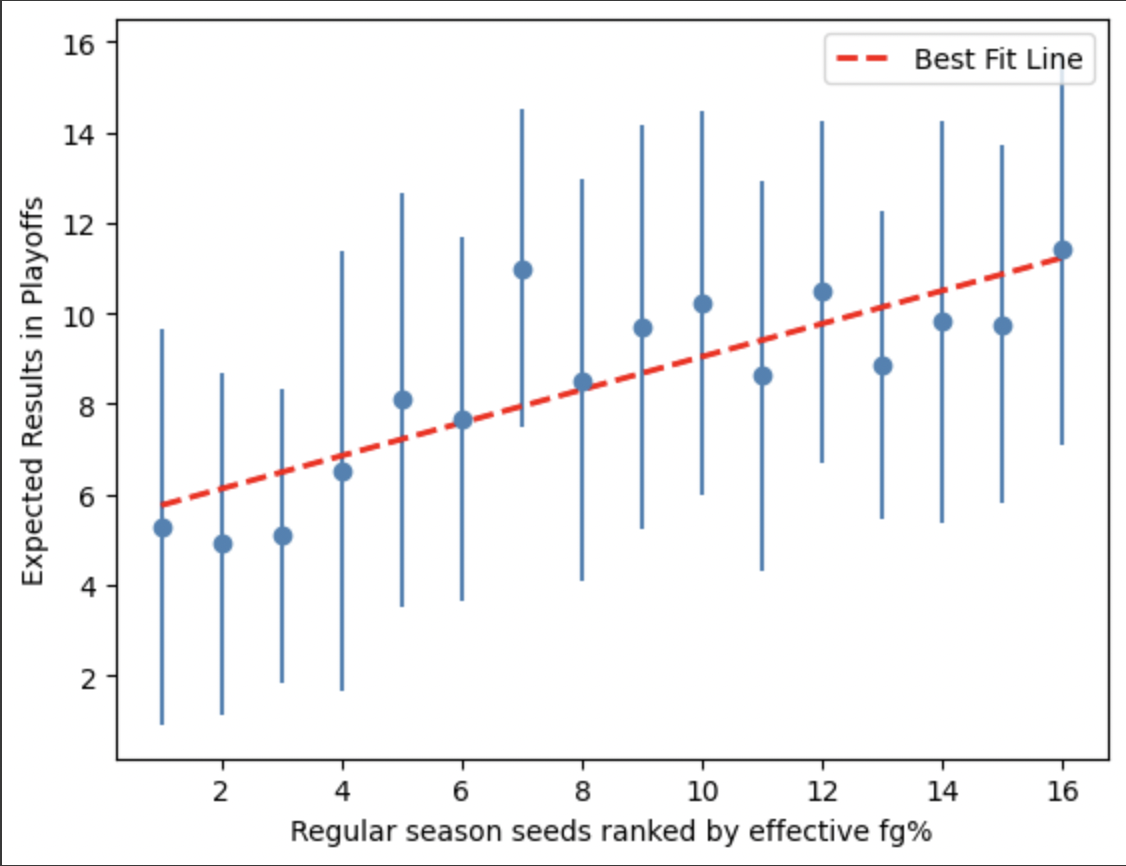
Figure 3: Expected Playoff Results vs. Regular Season Seeds Ranked by Effective Field Goal Percentage
Unfortunately, Figure 3 demonstrates that effective field goal percentage (adjusted for 2- and 3-point shots) turns out to be a poor predictor of playoff success. Our line of best fit is far from some of the points on the graph and an R-squared value of 0.686 is much less than ideal. This makes sense because prolific rebounding teams with many big men (think Minnesota) may be able to get away with a lower field goal percentage compared to a team composed mostly of sharpshooting guards.
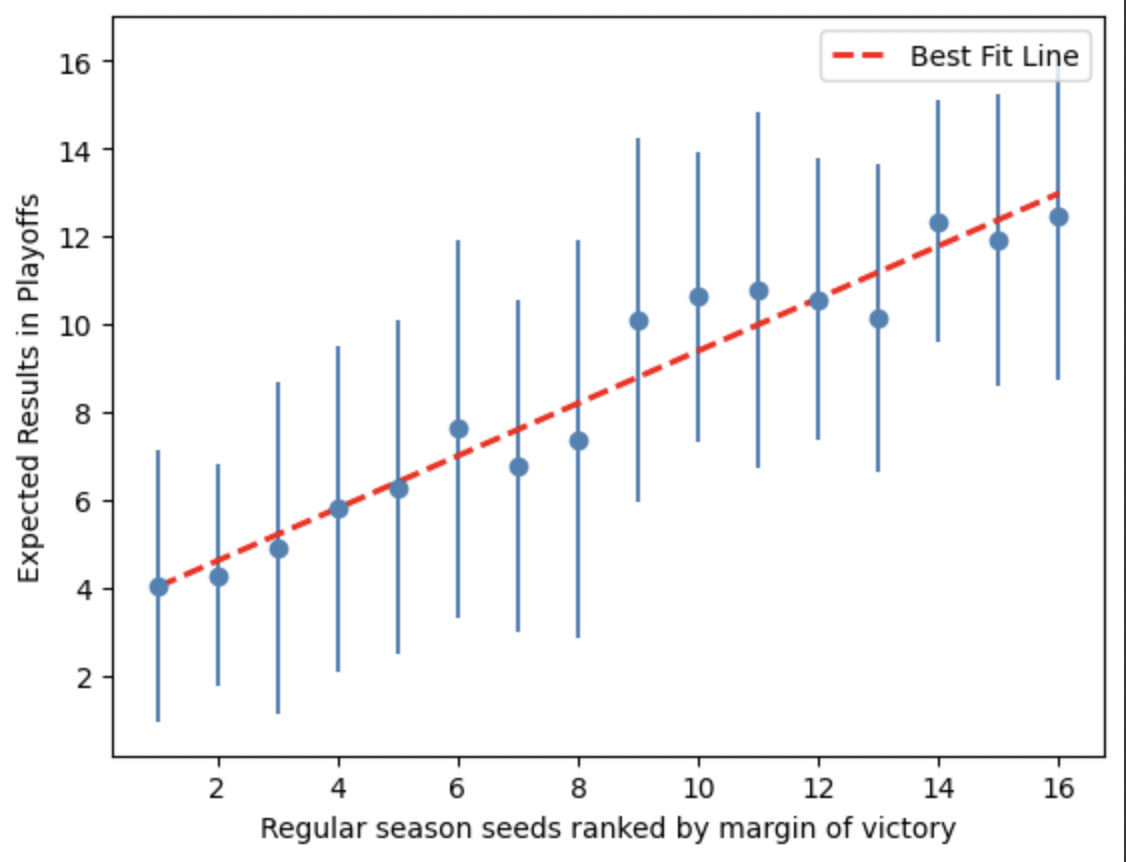
Figure 4: Expected Playoff Results vs. Regular Season Seeds Ranked by Margin of Victory
However, a much better predictor can be seen in Figure 4, which maps margin of victory to expected playoff performance. This model has the highest correlation coefficient of 0.941, which indicates a strong relationship between the two variables. Looking at the graph above, we see that our model is in fact more accurate for predicting the results for the best teams compared to the worst playoff teams.
Other Statistics
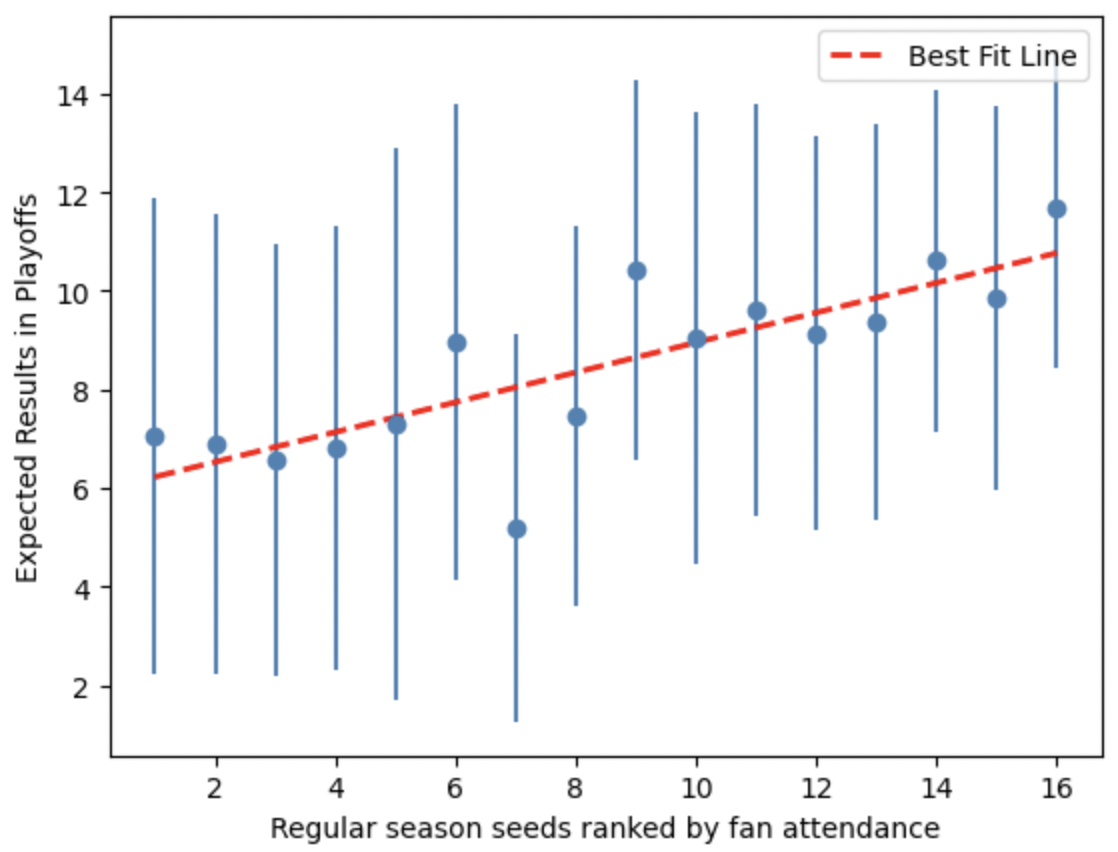
Figure 5: Expected Playoff Results vs. Regular Season Seeds Ranked by Fan Attendance

Figure 6: Expected Playoff Results vs. Regular Season Seeds Ranked by Average Player Age
Just for fun, we also tried creating seeds by fan attendance and average age of teams. These are wildly inaccurate (in other words, don’t build your betting models off of them) but it’s still interesting to see that there is some correlation between even seemingly random statistics.
Limitations, Future Analysis, and Conclusion
With all of our models, we were limited in the scope of our predictions. For example, our line of best fit never predicts any team to have a lower playoff result than 4, which means that we can’t use our model to actually identify who will be crowned champion (or even runner-up). Also, like most linear regression models, our model would likely work well over a long period of time but would not be as effective in predicting a single value, like the playoff rankings for the current year.
While we didn’t find a perfect model to predict playoff success (what would be the point of watching the playoffs if we did?), our research is indicative that regular season performance and margin of victory are strong predictors. We now know that these are the factors that matter most. So next time you make a poorly-guided bet with your friends about who’s going to win the NBA playoffs, make sure to look beyond the win-loss column and check the box scores too.
