
By Kevin Meers
Welcome, introductions, apologies
Along with many others this baseball season, it has been my pleasure to participate as an eager member of the Corey Kluber Society (or, frequently, just “the Society”). The Society, as outlined by Carson Cistulli of Fangraphs, is “composed of individuals all bound by their singular enthusiasm for the works and days of Cleveland right-hander Corey Kluber.” To celebrate the inaugural season of the Society, the self-constructed Subcommittee on Pitching Heat Maps (much more fun than the Subcommittee on Dirty Dancing) wanted to present a visual description of how Kluber went from a 0.5 WAR and 3.99 xFIP pitcher during the 2012 season to the 2.7 WAR and 3.10 xFIP pitcher in 2013. Thus, while the intrinsic beauty and grace of Kluber’s slider and sinker are well documented, the purpose of this presentation is rather to understand what changed in 2013, leading to Kluber’s breakout campaign. All of these visualizations were created through TruMedia’s dataset.
High-fiving throughout is encouraged, though not strictly required.
Exhibit A: Kluber’s Pitch Frequency and Effectiveness
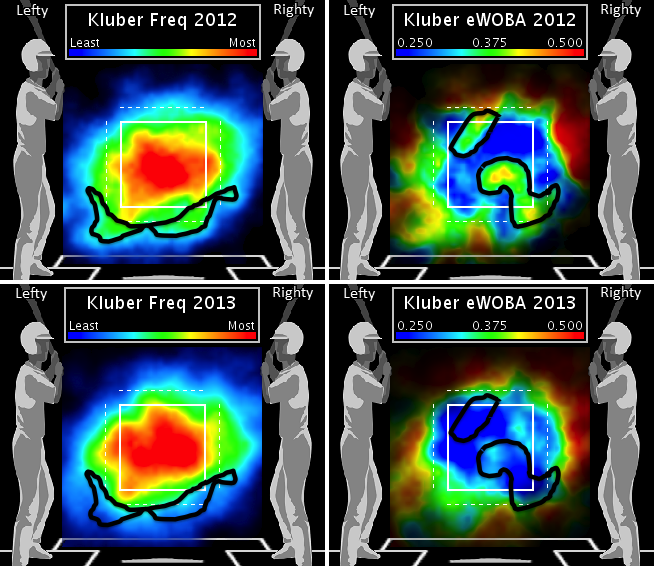
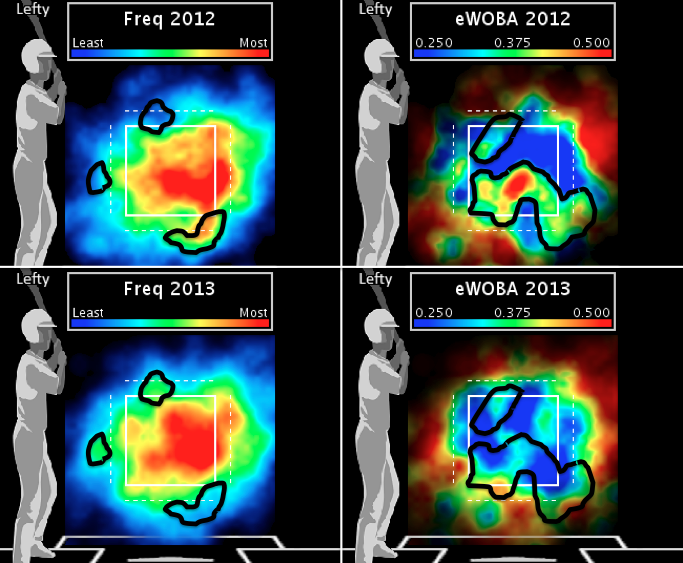
Two changes jump out at me from the expected WOBA (weighted on base average) heat maps, which I have highlighted above. One, Kluber became much more effective in the upper left corner of the strike zone. Two, the hot spot in the middle to lower right of the strike zone (mostly) disappeared.
I have included these frequency heat maps throughout the post to give context to the efficiency measures I’m focusing on. The next set of questions in our exploration of Kluber depends on batter handedness, pitch type, and our most human belief in right and wrong.
Exhibit B: Kluber Vs. Right-Handed Batters
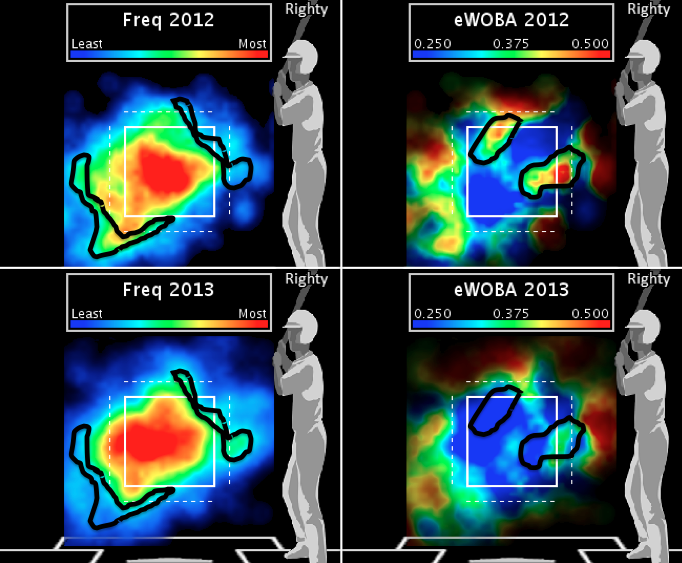
As is clear, there were two major zones of improvement in Kluber’s performance against right-handed batters: the upper left corner and middle and in. These improvements primarily came from increased effectiveness in Kluber’s fastball and curveball. As has been noted in many Society meetings past, Kluber excels at those actions that generally prevent the offense from scoring runs, most commonly involving the throwing of some combination of pitches that shine like the morning sun.
Exhibit B(1): Kluber Fastball vs. Right-Handed Batters
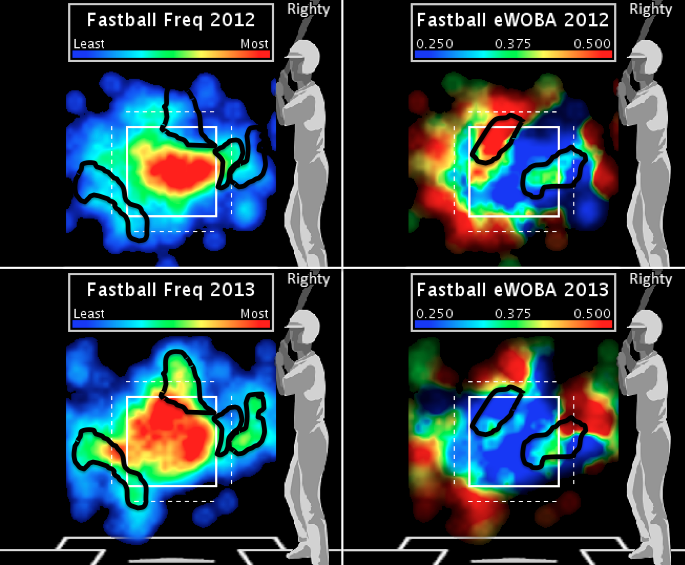
That red swath across the upper left corner in 2012 turned a deep blue in 2013, a drop from about 0.450 eWOBA to about 0.280 eWOBA. There isn’t nearly as big a change in efficiency for fastballs middle and in, but Kluber did throw more pitches to that zone this season, improving his aggregate performance. Further…
Exhibit B(2): Kluber Curveball vs. Right-Handed Batters
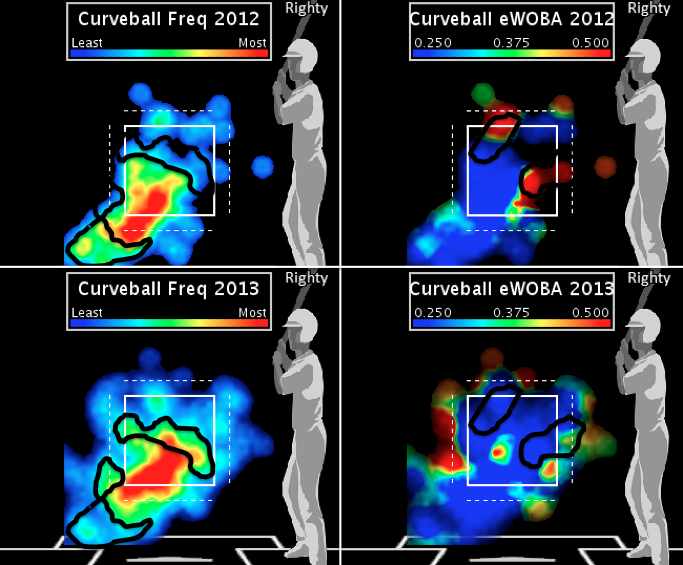
While he did not pitch there very frequently, Kluber’s curveball middle and in improved greatly in 2013, and helps explain why Kluber improved on pitches that were middle and in. His high curve also improved significantly, and further explains his improvement on pitches to the upper left corner. That said, Kluber’s curve low and away… Gaze in wonderment, should you so desire. (You so desire.)
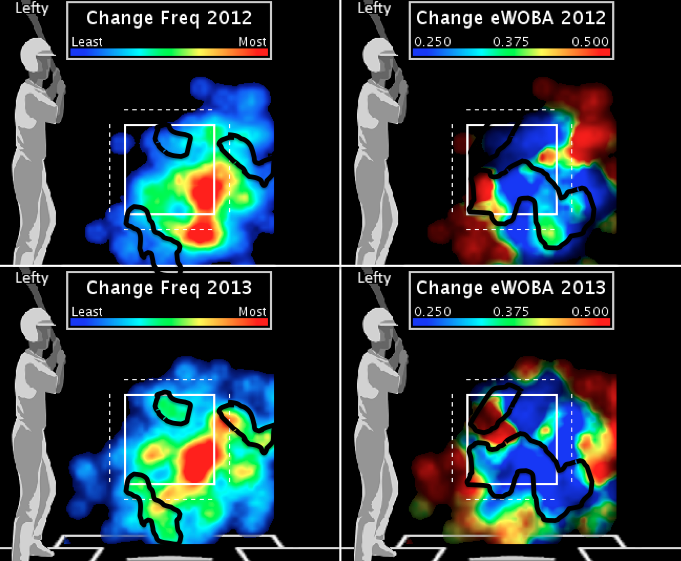
Exhibit C: Kluber Vs. Left-Handed Batters
That huge green swath with the bright red bulls-eye in the middle shrunk enormously in 2013, from about 0.400 to around 0.310 eWOBA. This change largely explains Kluber’s improved efficiency in the lower right corner of the plate from our first set of heat maps. He was also more effective pitching up and in to lefties, yet truly effective just about everywhere in the area surrounding the plate.
Exhibit C(1): Kluber’s Fastball Vs. Left-Handed Hitters

Well, there’s the change in that huge green swath. Kluber’s fastball against lefties went from brutally ineffective to effective in at least some spots. Fastballs to lefties over the middle of the plate are still an issue for Kluber, but when he puts it on the corners, they become much more effective. Just ask Adam LaRoche. Kluber’s fastball up and in also got crushed this past season, so there is one spot that still needs some work from our noble subject.
Exhibit C(2): Kluber’s Slider Vs. Left-Handed Hitters
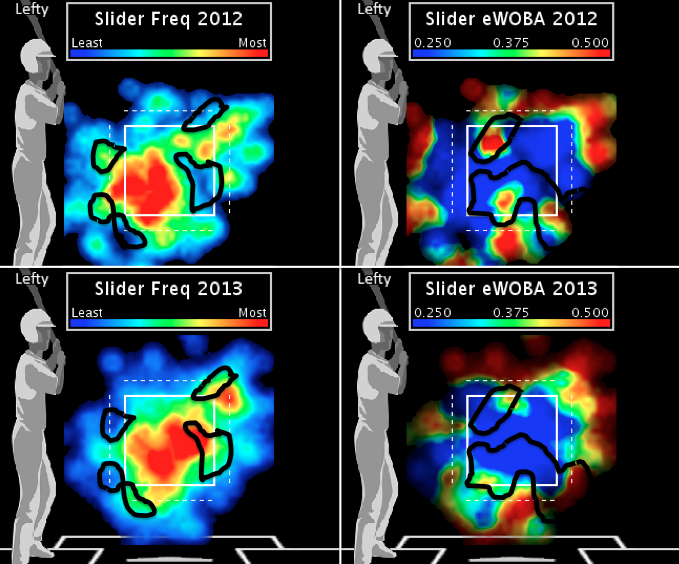
The three red splotches highlighted from 2012 mostly disappeared from the Kluber slider in 2013, which paints the strike zone a blue as deep as the Pacific.
Exhibit C(3): Kluber’s Changeup Vs. Left-Handed Batters
As our final piece of evidence, the Subcommittee of Pitching Heat Maps presents Kluber’s changeup against left-handed hitters. The most important change seen here is the change in frequency and effectiveness of changeups low and away from left-handed hitters. Kluber no longer throws them at as ferocious a rate, but when he does, they are much more effective. His changeup inside, which was most ineffective in 2012, also became a very efficient pitch this season.
Conclusion
While we eagerly await the announcement of the next formal Society meeting, currently scheduled for the week of March 22nd, 2014, let us never forget the bonds we share in support of this majestic season from Corey Kluber. The Subcommittee hopes this analysis has aided our collective understanding and appreciation of Kluber’s work.
Not to be a killjoy, but I find this shtick about the Kluber society a little tedious. There’s some good info here, but pretty tangled up.
This is a little confusing. But Kluber is definitely under rated