
Despite taking quite the beating recently, the Ratings Percentage Index (RPI) is still the official and favored ranking system of the NCAA Men’s Basketball Selection Committee. The RPI does not take into account margin of victory, making its predictive accuracy dubious at best when compared to rankings like Ken Pomeroy’s or Jeff Sagarin’s, which do include MOV. That is why I was stunned to hear Mike Bobinski, chair of the Selection Committee, say this last week:
“Interestingly, last week we asked a statistician that works with the NCAA who is really, really sharp, to sort of do a comparison of all the major different rankings that exist, including the RPI and others that you can all probably certainly come up with who they are, and compare those evaluations systems with performance in the tournament.
Interestingly, if we went through that, we were all surprised to see that the RPI actually did end up with the highest level of predictive value and the highest correlation with ultimately success in the tournament. That doesn’t mean we’re going to use it more or less this year. It’s just a very interesting piece of information.”
If that were true, it would run counter to all that we think we know about predicting college basketball games and assessing past performance. As Ken Pomeroy has shown recently, scoring margin in past matchups matters for predicting future matchups between two teams. I don’t doubt the sharpness of the NCAA’s statisticians, but I decided to do the analysis for myself.
As the results show, the claim that the RPI is the best predictor of NCAA Tournament results is absolutely wrong.
To evaluate the NCAA’s claim, I took the final RPI rankings prior to the NCAA Tournament for each year from 2007 through 2012 from Statsheet and RealTimeRPI and compared them to Ken Pomeroy’s Pythagorean ratings from just prior to the NCAA Tournament and my own Survival Analysis model, which incorporates Ken’s Adjusted Offensive and Defensive Ratings.
For each season, I filled out three brackets, one per system, by advancing the higher-ranked team in each game. While a matchup between two teams with very similar rankings in each system is largely equivalent to a coin flip, making simply advancing the higher ranked team not optimal, basketball games result in binary outcomes and any predictive system has to be evaluated in that framework. I looked at two primary measures: games projected correctly and the bracket score using the standard 1-2-4-8-16-32 point scoring system employed by ESPN.com and Yahoo’s bracket pools.
It matters not only how many games a system predicts, but also which games it predicts correctly. It is more valuable to correctly identify the NCAA Champion or Final Four teams than the winner of a first round game, and the prediction systems should be judged accordingly.

The table above summarizes the results of predicting the 2007-2012 NCAA Tournaments. The RPI is close to Ken Pomeroy’s rankings in terms of average games predicted, but is blown away by the Survival Model. Additionally, the RPI is much worse on the dimensions that matter: predicting Final Four teams and NCAA Champions. Both the Survival Model and Pomeroy’s rankings score far better and have identified more championship teams before March Madness begins.
The 2008 NCAA Tournament is instructive as to why the RPI is not as predictive of future results. Prior to the Tournament, the RPI ranked Tennessee as the best team in the country. While the Volunteers had had a tremendous season, they had also relied heavily on narrow wins. The Vols were 9-1 in games decided by fewer than five points to that point in 2008, and the SEC was one of the weakest major conferences.
Kansas, by contrast, had a much stronger margin of victory while running through the Big 12, the best conference in the country. Both Pomeroy’s model and my model ranked the Jayhawks first before the Tournament began. Pomeroy had the Vols ranked 19th; I had them ranked 23rd. As we now know, Kansas cut down the nets in a classic title game, while Tennessee lost in the Elite Eight to North Carolina. Ignoring margin of victory, as the RPI does, throws away valuable predictive information.
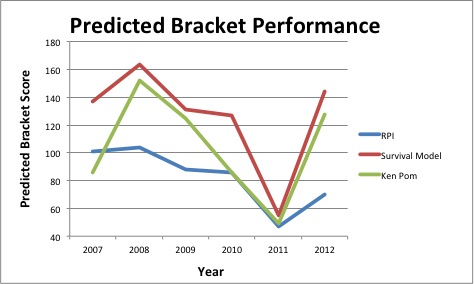
If you had filled out your bracket according to the RPI, you would have lost your office pool to a Survival Analysis bracket in every year since 2007, and only beaten a Ken Pomeroy bracket in one year, 2007. Even in 2011, when three-seeded Connecticut won and all predictive models did poorly, the RPI was the worst of the bunch.
The claim that the RPI is the most accurate predictor of NCAA Tournament results is simply not true. The Selection Committee uses the RPI as a main seeding criterion, which makes its relative failure as a predictive system even more glaring. If the brackets were seeded according to Pythagorean Expectation, Ken Pomeroy’s predictions would likely be more accurate.
The NCAA has its own– in my view, misguided– reasons for continuing to use a ratings system that does not account for margin of victory. One of those stated reasons, however, should not and cannot be its predicted accuracy. If you are trying to win your March Madness pool, you wouldn’t fill out your bracket according to the RPI. The NCAA should not set up its bracket according to the RPI, either.
Do you think that, if the NCAA’s primary seeding system did take margin of victory into account, that teams would try to run up the score? And that subsequently in that environment, margin of victory would lose some of its predictive value?
I ask this as a firm supporter of margin of victory (I have argued in the past that using simple functions of margin of victory that include a ceiling would be a decent compromise).
who cares? If a team can run up the score, let them. It’s up to the other team to stop them. It’s sports, after all.
I was not as concerned with the players’ feelings as I was with how it might change the predictive value of MOV.
I think the appropriate method for seeding (so as not to encourage running up the score) would be to not account for margin of victory of a given team, but to account for the SoS based on KenPom’s SoS.
A good method for this, and one I have advocated for a while, is to account all wins and losses as 20 point margins–so a 10-0 team would have a +20 margin from wins and losses, and then add on the KenPomSoS to that.
(I did a post on that methodology a couple of years ago: http://godismyjudgeok.com/DStats/2011/ncaa-basketball/ncaa-bayesian-analysis-dsmrpi/ )
In ’08, Tennessee actually lost in the Sweet 16 to Louisville (who then lost to UNC in the Elite 8).
But, yeah, really interesting stuff here. It’s no shock to see the RPI lagging behind. Would be curious as to how the Sagarin Predictor performed, too.
have you considered trying to obtain the NCAA stats person’s methodology? it would be interesting to see how he/she went about his analysis versus how you did.
I have never been a huge fan of the RPI, but I am curious how much the selection committee actually looks at the RPI based on the recent reports coming out of the media writers mock selection that there is no set criteria and the RPI isn’t discussed in great detail. Thoughts?
I interpreted their analysis as looking at the games 1-by-1, rather than forecasting the entire tourney in advance. So for example, if a 14 upsets a 3, and then the 14 is playing a 6 in the next round, RPI will say the 6 should advance (most likely), rather than a pre-tourney prediction that might have the 3 advancing.
I usually do not leave a ton of comments, however i did
a few searching and wound up here The RPI is Not the Real Predictive Indicator | The Harvard College Sports Analysis Collective.
And I do have 2 questions for you if you
don’t mind. Is it just me or does it seem like some of the comments look like they are left by brain dead individuals? 😛 And, if you are writing at additional places, I’d like to
follow everything fresh you have to post.
Would you make a list of the complete urls of your social sites like your Facebook page, twitter feed, or linkedin
profile?